
Have you been hearing about the powerful insights visual analytics provides ? This talk unravels the fascinating anomalies underlying the immense amount of political data available.
S Anand is a Chief Data Scientist at Gramener. He explores insights from data and communicates these as visual stories.
Tags: tedx tedxnmimsbangaloreYou might like reading:
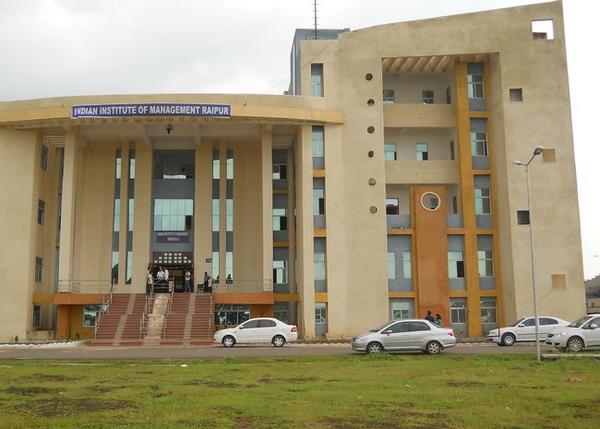
IIM Raipur Final Placements 2018-20: Highest salary of INR 46 Lacs
Indian Institute of Management, Raipur has announced the successful completion of the final placement for the MBA 2018-20 class. 150+ companies recruited from the institute, with 50+ first time recruiters, offering coveted roles in Sales and Marketing, Financial Management, Operations and IT, Analytics and Consultiting, and General Management. Growing by nearly 5%, the average salary package for the batch increased […]
Decoding NBFCs and impact of RBI norms
NBFC- Non Banking Financial Companies are financial institutions which offer all kinds of banking services but do not hold a license for being a bank. A NBFC is registered under the Companies Act, 1956. Banking services like loans and credit facilities, hire purchase, insurance, money markets, underwriting, merger activities, etc can be performed by them. Hence, NBFCs perform functions similar […]


