
“I am not too sure if we can continue with it further in similar way”, said Anand Bakshi to his store manager Vivek. “This is 6th straight month of loss for us from this store”. It was already more than 2.5 hours of their meeting. And yet no conclusion. Vivek left in despair. He knew situation was critical. They had increased their marketing budget at store level as well but all in vain. The footfalls did not increase even marginally. 7 years in operations; this was the first time Anand was considering to shut down a store.
Anand Bakshi had worked with a retail giant (which was frequently ranked 1 in revenue worldwide) in Canada for 11 years after completing his post graduate degree in management from India’s premier institute in 1982. In 1994 he returned to India to set up his own retail chain. In 1995 he opened two stores together in Pune under the name ‘Apna Store’ along with a warehouse. These stores offered fruits and vegetables, grocery and staples, beverages, and personal care. He knew that warehousing would play important role in expansion as retail is primarily about supply chain optimization. Details of store and their respective years of opening are given in Exhibit 1.
Pune was expanding in all directions in late 1990s. The city was attracting foreign capital particularly in IT, Automobiles and Manufacturing. It was becoming a preferred destination in India for job, education, healthcare treatment, real estate, and no doubt quality of life. Primary reason was the high cost of living in Mumbai. The city had witnessed CAGR of about 5% in the decade. Details of commercial establishments in Pune district are given in Exhibit 2. The estimated population growth of the district has been given in Exhibit 3.
Since 2008, the governing bodies of the city started to implement one way system as efforts towards a smoother flow of motor traffic. The problem for Anand led Apna Store started when the SG road, where his store PNE008 was located, was declared one way in March 2013. Layout for the same is given in Exhibit 4. Footfalls dropped drastically as the residential setup was mainly in the opposite direction. No doubt consumers diverted to ‘Hello City Mall’ where a national retailer had setup the store in 2010. It is September now and despite several requests from the store owners on SG road, the governing bodies show no sign of removing the one way constraint. SG Road is now moving from consumers’ destination to shoppers’ destination.
Anand is in a dilemma- Should be shut down the store and search for another location? But the real estate prices in medium to high population density have been sky rocketing. He is also considering opening up a store in Hello City Mall hoping his old customers might return though there is a national retailer present. Or should he wait for governing bodies decision to rollback chances of which cannot be determined? Help Anand come out of his dilemma at a time when corporate giants like Reliance, TATA, Aditya Birla Group are expanding rigorously in retail from fresh and FMCG to apparels and international giants like Walmart, Carrefour, and Tesco are waiting for the FDI to open up completely.
Exhibit 1
|
S.No.
|
Store Code
|
Year
|
|
1
|
PNE001
|
1995
|
|
2
|
PNE002
|
1995
|
|
3
|
PNE003
|
1997
|
|
4
|
PNE004
|
1998
|
|
5
|
PNE005
|
2001
|
|
6
|
PNE006
|
2003
|
|
7
|
PNE007
|
2004
|
|
8
|
PNE008
|
2006
|
|
9
|
PNE009
|
2008
|
|
10
|
PNE010
|
2012
|
|
11
|
PNE011
|
2012
|
Exhibit 2
|
Category
|
Establishments (Nos.)
|
Employment(Nos.)
|
|
Shops
|
11,718
|
28,866
|
|
Commercial Establishments
|
22,925
|
193,557
|
|
Hotels
|
3,967
|
9,237
|
|
Theatres
|
30
|
313
|
|
Total
|
38,640
|
231,973
|
|
Source: Pune Municipal Corporation: Environment Status Report, 2005
|
Exhibit 3: Population Growth Estimate
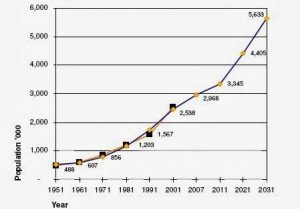
Exhibit 4: Area Layout
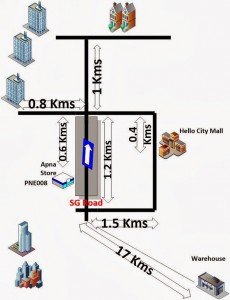
Exhibit 5
|
Year
|
Average net sales growth per store in %
|
|
2005-2006
|
45
|
|
2006-2007
|
42
|
|
2007-2008
|
35
|
|
2008-2009
|
24
|
|
2009-2010
|
20
|
|
2010-2011
|
34
|
|
2011-2012
|
29
|
|
2012-2013
|
25
|
Exhibit 6: Costs shown are average across all stores. They may vary per store
|
Activity
|
Cost as % of Sales(Year 2012-13)
|
|
Rent
|
12%
|
|
Electricity
|
2.50%
|
|
Employees
|
5.50%
|
|
Maintenance
|
2%
|
|
Promotional Activities
|
1.50%
|
|
Others
|
6%
|
|
Total
|
30%
|
Exhibit 7: Operating Profit Margin
|
Year
|
Operating Profit Margin
|
|
2005-2006
|
11%
|
|
2006-2007
|
11.50%
|
|
2007-2008
|
9.80%
|
|
2008-2009
|
7.60%
|
|
2009-2010
|
7.20%
|
|
2010-2011
|
8.20%
|
|
2011-2012
|
7.80%
|
|
2012-2013
|
7%
|
The case is a work of fiction and serves pure educational purpose.
You might like reading:
I am passionate about learning and trying out new things, Sadaf Zia NMIMS Mumbai 2016-18
Interview with Sadaf Zia NMIMS Merit Rank : HR Rank 316 Firstly, congratulations onconverting your call to NMIMS. Our readers would like to hear something about your background? I did my schooling from DPS Bhilai following which I did my B.Com from St. Thomas College, Bhilai. I did not have any prior work experience. “Why MBA” must be a common question […]

Try to differentiate between knowledge and learning : Tushar Jain, Enthu.AI
We recently caught up with Mr. Tushar Jain who is the founder at Enthu.AI, a B2B enterprise software to help voice teams improve the quality of their conversations. Tushar is also an ardent book reader, a personal finance blogger and a lifelong student of sales & marketing. Let us hear about his story: Q1. Tell us something about your journey […]


