Recently I attended a seminar where the guest speaker was Mr. Ridham Desai. Mr. Desai is Head of Indian Equity Research team at Morgan Stanley, India. Reflecting on his comment – “Grandmother of bull runs is yet to come”, I decided to do a small analysis to cross check his claim. Yes, this is a little presumptuous on my part. However in the interest of my “limited capital”, a little validation was worthwhile.
The data point is from 2000 onwards. To begin with, my focus has been on the most basic multiple – P/E. Look at the below chart. The red circles show the peak P/E reached by SENSEX during each of the bubbles (i.e. tech and subprime crisis). The number hovered around a mind numbing 28x. Comparing this to the current range (since the last 2 years, SENSEX has been trading in a broad range of 18-20x), if we consider the long term horizon – the rally still has a lot of leg.
Chart 1: P/E movement
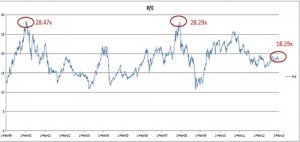
Source: BSE India
The next analysis is a cumulative comparison of P/E, P/B, Div Yield and Nifty movement. This analysis does not help ascertain the inflection point (personally I am not insightful enough to notice one). However, it surely helps ascertain the GAAP and GARP concept discuss by Mr Desai. If you observe the graph (below), there was a long period when the Nifty/SENSEX traded below their respective book values. This is as recent as 1999-2002.
Chart 2: Cumulative
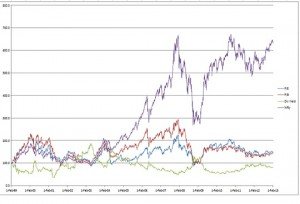
Source: BSE India
Inference – Even my grandmother could make money in the markets. Jest apart, this was surely one Inflection point.
However, coming to more recent times, it is interesting to note the P/E and P/B movement from 2008 to 2012. During the 2008-09 crisis, the prices went on climbing without actual change in fundamentals. The companies earnings did not keep pace with the rise in price. It was an actual situation of – “Buy on rumours and sell on NEWS” – or maybe, not sell at all!
However this time around, specifically the period from 2011 onwards, the prices have inched up but the P/E and P/B has not. Using simple mathematics, it is easy to determine here the increasing earnings and rising book values – a clear indication of corporates strengthening their balance sheet and tightening their belts.
However, coming back to our core discussion – I personally feel, the market is in a consolidation stage. Do not look at the absolute figure. It does not indicate “value”. I would rather look at P/E and P/B to get a better picture of where the broader market stands. Currently, we are in a side-ways movement scenario. When this will turn? – I am too naïve to comment. But when it does turn, it will take a lot of people by surprise.
So vindicating Mr. Desai’s claim, the ‘Grandmother of bull runs is yet to come“.
[The article is written by Mr. Varun Joshi. He is the Managing Partner of AV Realty Corp. and is a keen follower of Indian equity market.]
[The article is written by Mr. Varun Joshi. He is the Managing Partner of AV Realty Corp. and is a keen follower of Indian equity market.]
You might like reading:

Measuring the Impact of Social Media Marketing !
Abstract Most companies these days are taking the social media marketing route. They invest a lot of time, money and efforts in it and yet feel lost. This mostly happens because they fail to quantify the effectiveness of their campaign. This article proposes a Four-Point model to measure the impact of social media marketing by capturing various elements like exposure, […]

Land acquisition or Customer acquisition : Are they similar?
While there has been a lot of buzz over methods adopted for land acquisition in India in recent times specially in Noida and Singur, a random thought actually crosses the mind: Is customer acquisition similar to land acquisition ? In first look, the concepts look poles apart, but are they really different? Let us consider how: 1. Both require convincing : […]