The Elliot wave theory or the 5-3 curve is an extremely convenient tool for judging the trends in stock and commodity prices. The Elliot wave is marked by 5 impulse waves marked by 1,2,3,4 and 5 and 3 correction waves a,b and c. In the Elliot wave theory, the pattern keeps on repeating itself and each point on the curve is composed of several 5-3 waves. The topic to explore therefore is can the 5-3 curve pattern be replicated in other scenarios as well? Do other waves also reflect a 5-3 pattern? Perhaps one does.

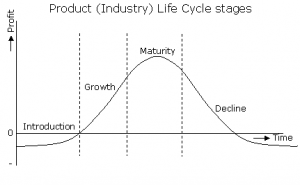
The product life cycle curve reflects the four stages in the life cycle of a product: Introduction, growth, maturity and decline. The nature of the curve appears smooth unlike the 5-3 curve and stock market pattern. So how does these two curves become similar ?
While making the product life cycle curve we often tend to assume the existence of a single product in isolation. This is never the case in real market scenario as there are always substitutes available. One can easily argue that for a totally path breaking product like say iPhone there were no substitutes and hence this consideration is not valid. However, the point to consider here is iPhone still remains a mobile communication device and there existed other devices in this segment. So even in case of path breaking products there are always other substitutes available.
Now consider that there is a product A in the market and does relatively well in terms of sales. After a certain period, product B (a slightly improved product) is launched. What happens to sales of product A? It falls while those of product B tends to rise. Product A starts investment in R&D and re-launches a better product. Sale of B drops which forces it to investment in development and regain the market share.
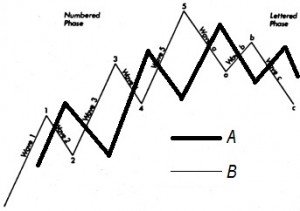
Are we not seeing a repeat of the 5-3 curve? If we examine closely, we will find two parallel 5-3 curves of A and B in different stages. When B enters the market, it reflects curve 1, while A enters curve 2. Similarly when product A gets re-launched, it enters curve 3 while product B enters curve 2. On a similar note, when the market will decline, both product A and B will enter the a-b-c correction wave pattern. Hence if we focus on two parallel product life cycle curves we can find the formation of a 5-3 curve.
This is important especially in case of hyper competitive markets as all the products will try to outperform each other leading to formation of a 5-3 pattern. For example, in discount stores the price of one product is reduced and matched with better quality. If Big Bazaar introduces a certain discount, it more than likely that similar offers will also be available to match or even better that in competitors like Vishal Megamart- thus implying the existence of Elliot wave.
However, it remains to be explored whether 5-3 curve can work in a highly differentiated product market not affected by price.
You might like reading:
Can Sales Promotion outrun Advertising?
Advertisements and Sales Promotions are heavily used by most organizations in tandem with an objective to achieve their ultimate goal: drive sales. Often they have been used in close association, and consequently the boundaries between the two have blurred. Sales promotions seem to drive the sales at the ground level, and the importance of advertising seems to be diminished. As […]

How Cinderella is affecting Microsoft?
Microsoft is one of those rare companies that Jim Collins refers as “Great by Choice” in his book by the same name. In fact, Microsoft was the only company to realise the importance and market for software in the age when IBM was the dominant player and a young Apple Computers was still making its way. Today Microsoft stands as […]